Jun 16 | Structure
Rising to the Clouds with Confidence
By Jon Galsworthy
The Upper-Level Wind Climate Assessment for the Jeddah Tower
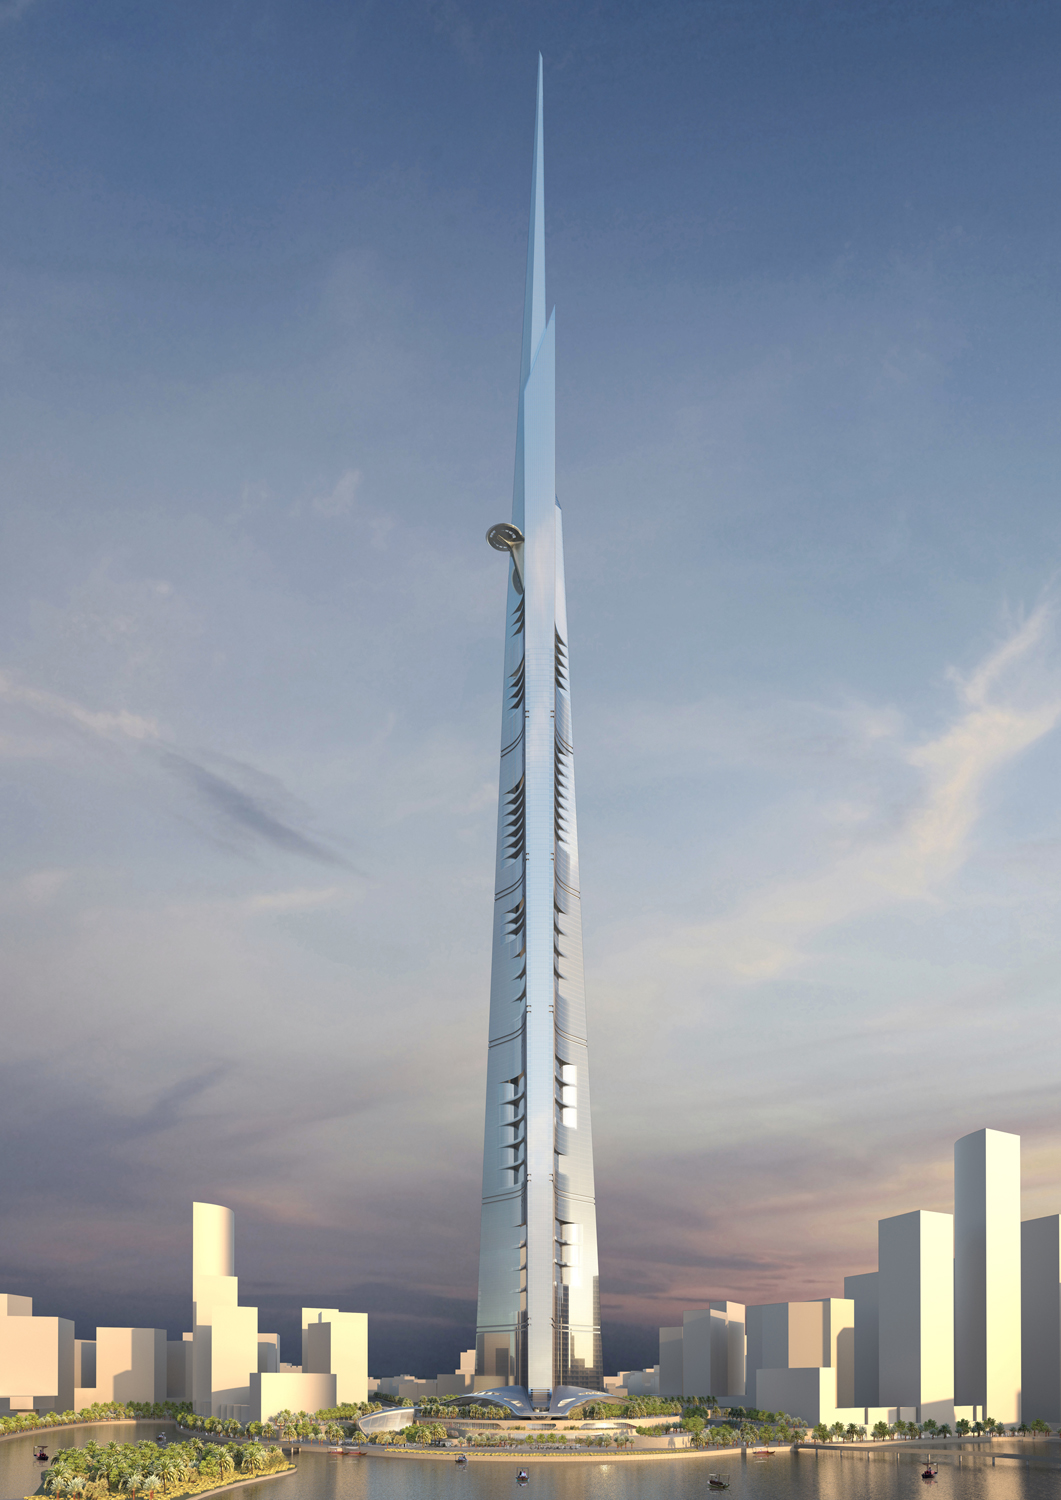
On a clear day, you can see forever,” the old song says. From the windows of Saudi Arabia’s Jeddah Tower, eventually more than 1000 meters (3,281 feet) above the port city for which it is named, the old song will no longer be poetic hyperbole. The spectacular views are easy to imagine. However, suppose the tune changes to “Stormy Weather.” It is much less romantic to picture a windstorm roaring outside your window when you are standing on the 167th floor.
In this situation, what will matter to occupants is the structure’s capacity relative to the demands such weather imposes. The task of characterizing windstorms for the structural engineering design of the Jeddah Tower was in the hands of the wind engineers of Rowan Williams Davies & Irwin Inc. (RWDI). The challenge RWDI faced was that nobody had actually studied, in detail, what a windstorm does at such extreme heights above the earth’s surface.
Beyond Surface Models
The first step in any wind engineering analysis is to develop an engineering model of the wind characteristics at the building site. The typical approach adopted for most buildings is to start with design wind speeds –provided in building codes or generated from statistical models derived from historical wind measurements – and then extrapolate up to the height of the building by using simplified engineering models of the planetary boundary layer. This layer is the portion of the atmosphere closest to the earth’s surface, where the wind speeds depend on the roughness of the surface terrain.
A consensus in the wind engineering consulting community is to rely on the standard engineering model of the planetary boundary layer developed by Deaves and Harris. Although a simplified model for very complex physical phenomena, it has proven effective for the design of many tall buildings.
For a structure of such an extreme height as the Jeddah Tower, the wind loads and wind-induced motions depend primarily on wind conditions near its top. However, it was recognized that the project might push the limits of the Deaves and Harris model. Most structures sit entirely within the planetary boundary layer, the layer of the earth’s atmosphere closest to the ground that is most heavily affected by the properties of the underlying surface, such as terrain, urban surfaces, and interfaces between the land and water bodies. At its upper reaches, the tower enters a region above the boundary layer sometimes referred to as the free troposphere. This region is where the effects of larger masses of air called synoptic systems determine the weather with very little influence from boundary layer features. These systems include features familiar from television weather maps, such as major storm fronts and low-pressure regions.
Ideally, wind engineers would develop and validate a new engineering model specific to this situation, but such an approach is not practical over the course of the design of a single project, even one so extreme as the Jeddah Tower. Instead, RWDI engineers had to find ways to determine the usefulness and limits of the standard model of the planetary boundary layer to ensure the safety and performance of the building. Their solution was to exploit additional data sources and advanced simulation techniques.
A First Approximation
Weather balloons reach heights comparable to the Jeddah Tower, and beyond. They, therefore, provide a source of wind speed data that could be used to augment historical surface measurements. About 17 years’ worth of good-quality wind data were available from balloons released at the Jeddah International Airport. By interpolating measurements taken at various heights, data sets for the surface and 350, 600, and 1000 meters (1,148, 1,968 and 3,281 feet, respectively) were created. From these data, RWDI could develop a statistical model to predict the frequency of wind speeds at each of these four heights.
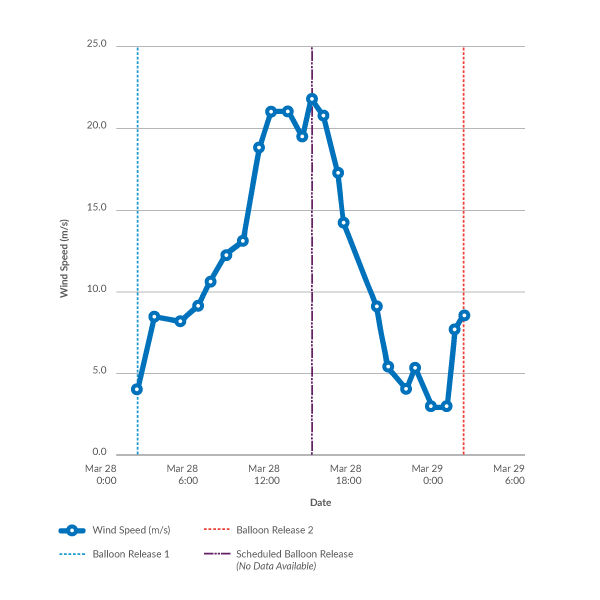
The difficulty with this approach is that balloon measurements tend to underrepresent extreme wind events. Typically, balloons are launched only twice a day. If high winds occur between balloon ascensions, the peak wind speeds associated with that event are non-existent in the collected data. Furthermore, balloons are rarely released in high winds, so entire events may also be missed. An example is shown in Figure 2, where a day-long high-wind event prevented a release, causing a 24-hour gap in the data.
Also, further uncertainty to the analysis of balloon data is introduced due to the measurement duration of the wind speed. Rather than taking a long enough sample to determine the mean wind speed at each elevation as the balloon ascends, the wind speed is instead instantaneously measured and thus may reflect a localized gust.To get the hourly resolution needed to model the wind climate at the upper reaches of the Jeddah Tower with greater confidence, RWDI adopted a second strategy: mesoscale modeling.
A Bigger Picture for Finer Detail
To get the necessary wind climate detail, RWDI turned to the Weather Research and Forecast Model (WRF, pronounced “worf”), which draws on the expertise and data of many governmental and academic institutions. This state-of-the-art weather model simulates atmospheric circulation at the mesoscale, that is, on scales ranging from hundreds of meters (feet) to thousands of kilometers (miles).
However, WRF could not pull historical data out of thin air.
Thus, initial and boundary conditions for RWDI’s WRF model were set by using the Global Forecast System (GFS) reanalysis data, developed by the U.S. National Ocean and Atmospheric Administration (NOAA). This dataset is based on “reanalyzed” historical archives from a worldwide meteorological observation network. In the reanalysis, a mesoscale model is run in “hind-cast” mode on the archival data to retroactively simulate the weather, thus generating a fully detailed meteorological dataset (with a resolution of 1.0 degree everywhere on the planet) calibrated against measured values.
RWDI ran their WRF model in a “nested” approach, using three iterations on progressively finer grids (36, 12, and 4 km; 22, 7.5, 2.5 miles) centered on Jeddah. The model was also configured with a total of 35 vertical levels from the ground surface to 100 millibars (about 16,000 meters or nearly 10 miles above sea level). The vertical resolution was higher within the region of most interest, with 20 layers representing the region from ground level up to about 2000 meters (2,187 yards). This numerical strategy of nesting and vertical discretization offered a balance between computing requirements and detailed output specific to the project location.
The WRF simulations generated 87,000 records for each grid cell, giving hourly resolution for the period 2001 to 2010, inclusive. For each record, a vertical profile of wind speed and direction was extracted at the Jeddah Tower site and used in the subsequent analysis.
Validating the Detailed Model
The next step was to determine whether this WRF model for the project location produced reasonable results. RWDI did an hour-by-hour comparison of the two sources of surface wind data, checking the data generated by the WRF model at the tower versus the surface wind data measured at Jeddah International Airport.
As expected, the datasets were relatively well correlated, but they differed in two key ways: The WRF modeling data gave higher wind speeds for milder wind conditions, and the airport data corresponded to higher wind speeds in stronger wind conditions.
Several factors attributed to the differences, including inaccuracies associated with the inertia of rotating cup anemometers used at the airport; differences in upwind terrain between the Jeddah Tower site and the airport; the use of point measurements at the airport versus area-averaged speeds in WRF; and, known limitations associated with atmospheric physics modeled by WRF, in particular for more localized weather phenomena such as thunderstorms.
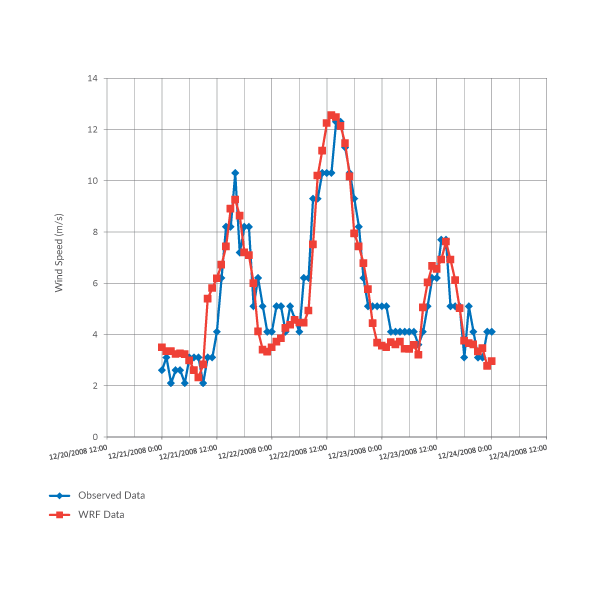
The next step in validating the WRF data focused on high-wind events because those were of primary interest. The wind engineers extracted records of strong windstorms from both WRF model and airport data, and plotted the time series for comparison. As an illustration, a strong wind event from the prevailing wind direction (north-south) is given in Figure 4. While there are some differences, the correlation between the WRF and, in general, surface data is very good. Wind events from east-west directions did show some differences between the datasets in wind speed and temporal shifts. These differences can be attributed to differences in site exposure, as mentioned earlier.
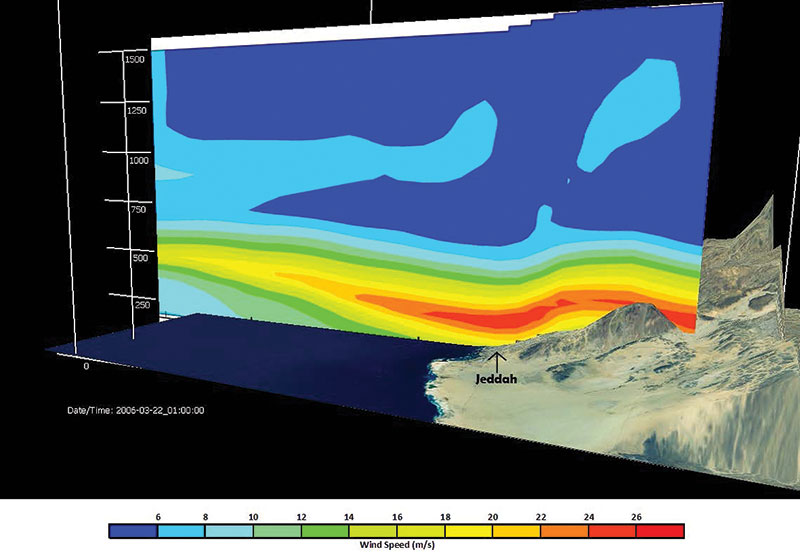
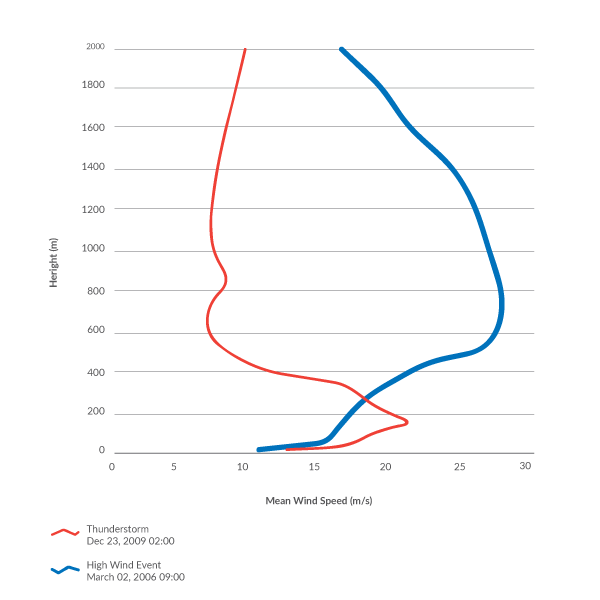
Individual vertical profiles of winds were extracted from the WRF data and reviewed with a focus on the higher wind events at each height. Figure 5 shows two vertical profiles from separate strong wind events in the 10-year period modeled. One profile indicates a very deep boundary layer for much of the storm, as indicated by the consistent increase in wind speed with height. More frequently, though, these profiles show that the wind speed is higher near the surface while relatively benign at the top of the tower. This type of profile is consistent with thunderstorms where microbursts are created by cold air masses descending from a storm cell.
Implications for Design
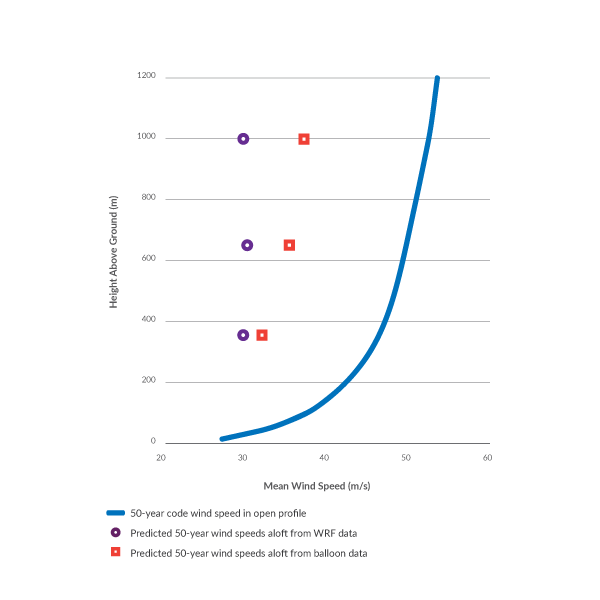
To evaluate the implications of the data for the design of the building, RWDI engineers further compared the WRF simulation results and the analysis of the balloon data to the standard engineering model. Surprisingly, for heights of 350, 650, and 1000 m, the standard model was found to be quite conservative. The profile wind speeds from the code were significantly higher than speeds obtained from both the airport data and the WRF model (Figure 6). This discrepancy indicates that the open profile assumed for the boundary layer and applied to wind speeds at the height of 10 meters is sufficiently conservative in accounting for the wind speeds aloft.
The demonstration that code wind profiles were conservative reassured the project design team and the owners, although this result did not prompt a reconsideration of the wind profiles for the project. It did, however, support a reduction of 20% in the wind speeds used to evaluate the serviceability of the structure, which allowed the design team to improve the performance of the building significantly from that perspective. Anchored in the actual, the RWDI analysis built a credible picture of the possible, allowing the project’s structural engineers to design a building where occupants can live safely at 167 stories above the ground.